Band structure and density of states#
Note
This notebook can be downloaded as silicon_band_dos.ipynb and silicon_band_dos.md
In this example we will perform band structure and DOS calculation for silicon using VASP. We will use the VaspBandWorkChain from the aiida-vasp plugin.
It is recommended to go through the single point calculation tutorial first before proceeding with this example.
Setting up the environment#
The code block below configures the environment for this example. Please see the single point example for more details.
from aiida_vasp.utils.temp_profile import *
from subprocess import check_output
print(load_temp_profile())


# Uncomment the below line to create a localhost Computer if you have not done so
comp = orm.Computer('localhost', 'localhost', transport_type='core.local', scheduler_type='core.direct')
comp.store()


# Some configuration may be needed for first-time user
import os
from pathlib import Path
comp.set_workdir('/tmp/aiida_run/')
comp.configure()
vasp_path = check_output(['which', 'mock-vasp'], universal_newlines=True).strip()

vasp_code = orm.InstalledCode(comp, vasp_path, default_calc_job_plugin='vasp.vasp')
vasp_code.label ='mock-vasp'
vasp_code.store()
os.environ['MOCK_VASP_REG_BASE'] = str((Path() / 'mock_registry').absolute())
os.environ['MOCK_VASP_UPLOAD_PREFIX'] = 'band'

# Upload the POTCAR files
from aiida_vasp.data.potcar import PotcarData, PotcarFileData
from pathlib import Path

print(PotcarData.upload_potcar_family(str(Path('potcars').absolute()), "PBE.EXAMPLE", "PBE.EXAMPLE"))

# Setting up the silicon structure
from ase.build import bulk
si = bulk('Si', 'diamond', 5.4)
si_node = orm.StructureData(ase=si)
Profile<uuid='a108ce48dae342fea4c164c0ba152165' name='myprofile'>
(1, 1, 1)
Setting up the band structure and DOS calculation#
Similar to the single point calculation tutorial, we will use a VaspInputGenerator to setup the inputs
for the VaspBandsWorkChain:
from aiida_vasp.workchains.v2.bands import BandOptions
from aiida_vasp.protocols.generator import VaspBandsInputGenerator

upd = VaspBandsInputGenerator()
builder = upd.get_builder(si_node, code='mock-vasp@localhost',
                          run_relax=False,
                          overrides={
                            'scf':
                            {'potential_family': 'PBE.EXAMPLE'},
                            })
The workchain can be modified with several options. These options are stored in the the band_settings input node which of the type orm.Dict.
The available options can be printed using the aiida_description() method.
opt = BandOptions()
print(opt.aiida_description())
# Or by accessing the help with
?builder.band_settings
                              symprec:  float
                                        Default: Precision of the symmetry determination
                            band_mode:  str
                                        Default: Mode for generating the band path. Choose from: bradcrack, pymatgen,seekpath-aiida and latimer-munro.
                band_kpoints_distance:  float
                                        Default: Spacing for band distances for automatic kpoints generation, used by seekpath-aiida mode.
                         line_density:  float
                                        Default: Density of the point along the path, used by the sumo interface.
                 dos_kpoints_distance:  float
                                        Default: Kpoints for running DOS calculations in A^-1 * 2pi. Will perform non-SCF DOS calculation is supplied.
                             only_dos:  bool
                                        Default: Flag for running only DOS calculations
                              run_dos:  bool
                                        Default: Flag for running DOS calculations
  additional_band_analysis_parameters:  dict
                                        Default: Additional keyword arguments for the seekpath/ interface, available keys are:  ['with_time_reversal', 'reference_distance', 'recipe', 'threshold', 'symprec', 'angle_tolerance']
                    kpoints_per_split:  int
                                        Default: Number of kpoints per split for the band structure calculation
                 hybrid_reuse_wavecar:  bool
                                        Default: Whether to reuse the WAVECAR from the previous relax/singlepoint calculation
Hint
This can also be done for other Option classes such as relax_settings for the VaspRelaxWorkChain which uses the RelaxOptions class.
Run and inspect the results#
We can now run the workchain and get the returned WorkChainNode object.
band_out = upd.run_get_node().node
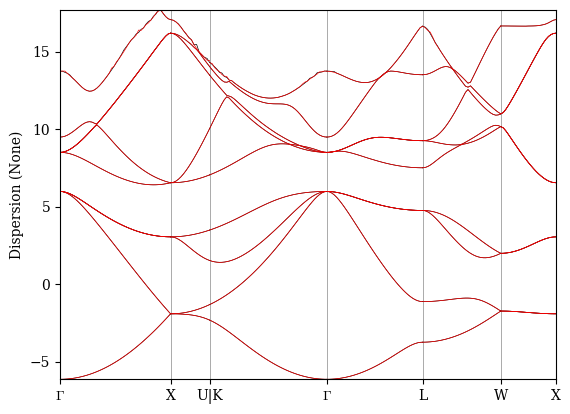
The computed band structure is stored as a BandsData object in the band_structure output port. We can plot the band structure using the show_mpl method provided.
band_out.outputs.band_structure.show_mpl()
Matplotlib is building the font cache; this may take a moment.